MEASUREMENT OF FREQUENCIES AND TIME INTERVALS
The purpose of this practice is students to get familiar with methodologies of low and high frequency measurements and to acquire skills for accuracy check.
1. Theoretical introduction.
The signal frequency is one of the main signal parameters, characterizing an electric harmonic process, and it is defined by the number of periods over sample of time (most often it is related to one second). In human industrial practice, the frequency domain is extremely huge starting from 10-4 Hz leveraging to up to 1015 Hz. The contemporary measurement equipment has accuracy equal approximately to 10-10. This high accuracy is the key for different kinds of signal parameters measurements, conducted after their conversion to frequency.
The main methods of frequency measurements are:
- low frequency measurements – methods of acoustic vibes comparisons, method of CRT (Cathode Ray Tube), method of capacitor recharge, absolute method (counting method);
- high frequency measurements – methods of comparison, capacitor method, method of the heterodyne, absolute method;
- superhigh frequency measurements – resonance method.
For the low and for the high frequencies the methods are similar. The absolute method is performed by electronic digital frequency counter.
The capacitor recharge method.
The principle of this method is represented in figure 1. There, the signal with unknown frequency fx switches the electronic key, who’s function is to switch between positions 1 and 2. This leads to capacitor inclusion and exclusion from the one of the two electric current circuits. Inclusion and exclusions lead to charging and discharging the capacitor form voltage source Estab respectively. For the time of the first semi period of the unknown frequency fx, the capacitor C is charged by the source Estab through the resistance Rcharg , and for the second semi period, C is discharged through resistance Rdisch and Current measurer (galvanometer) G. The capacitor charging constant and the discharging constant are chosen extremely small in comparison with the semi period of the highest measured frequency. The value of momentum current is calculated by:
Nevertheless, the Current measurer G reacts only on Current mean value Imean=I0 for which we have:
where since T>>τdisch and is the period of the measured frequency.
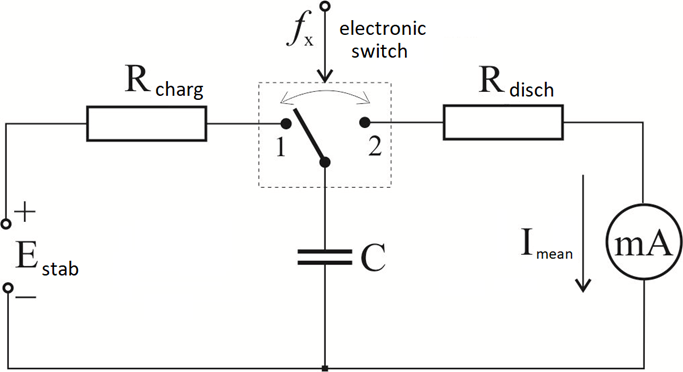
Fig. 1
If the product Estab.C is a constant value, indications on G will be proportional to the measured frequency fx and its scale can be marked as drawn sector lines, but taken in mind a transfer coefficient KF :
,
where N is the number of drawn sector lines.
A block-scheme of an electronic digital frequency counter, working on the principle of capacitor charge, is depicted on figure 2.
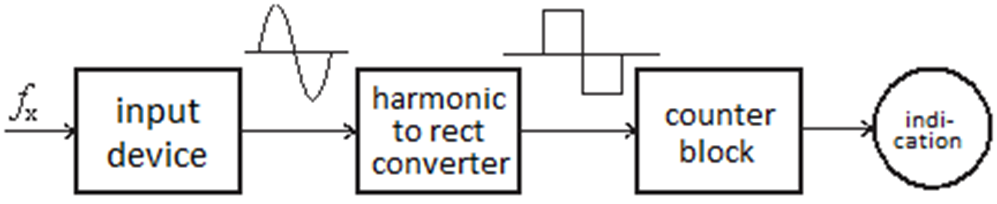
Fig. 2
The comparison method
By the means of this method, the measured frequency is calculated in equalty or in a multiple value of a given reference frequency. To perform a measurement of fx we need a source of reference frequency fref , and an indicator for equalty or multiple. For a label frequency generator a stable oscillators with minor frequency deviation (10-9 ÷10-11 Hz) are used. As a multiple or as an equalty indicator, an oscilloscope or a nonlinear frequency converter may be used.
Fig. 3
2. Practice tasks and instructions:
The connection circuits should contain the following equipment:
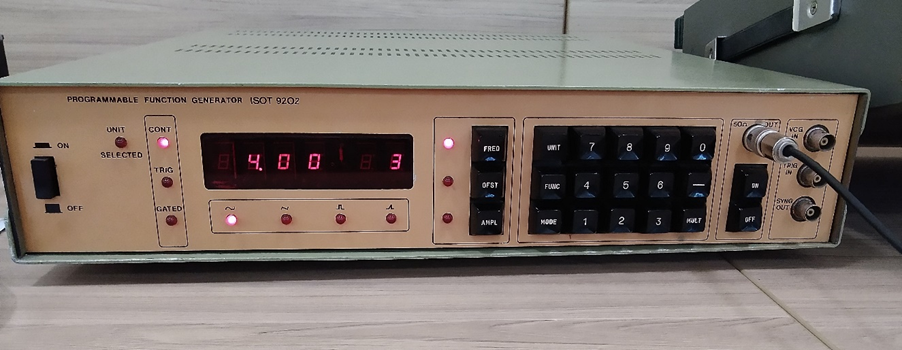
- low frequency signal generator “ISOT 9202” – 1 pcs.;
- electronic-digital frequency counter „PFL-30“ – 1 pcs.;
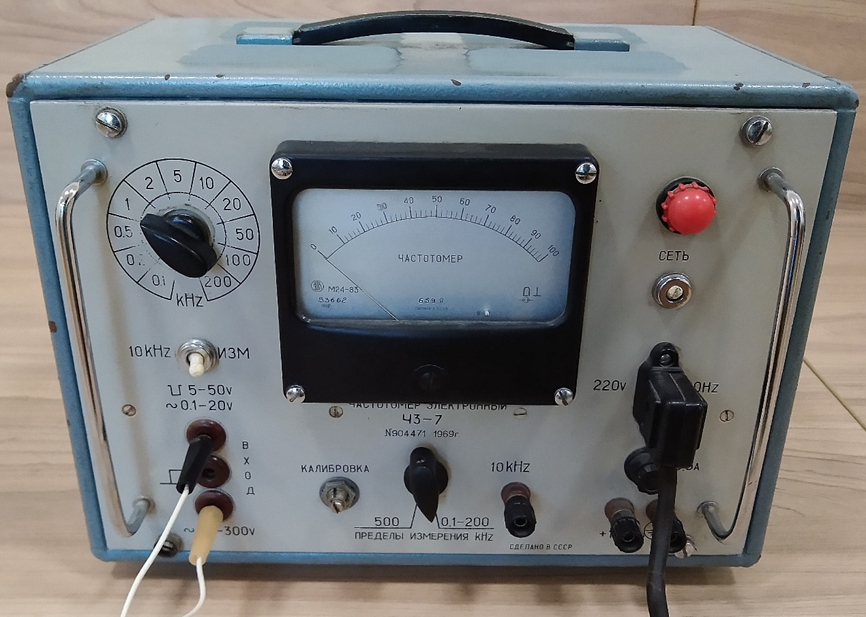
- capacitor frequency counter – 1 pcs;
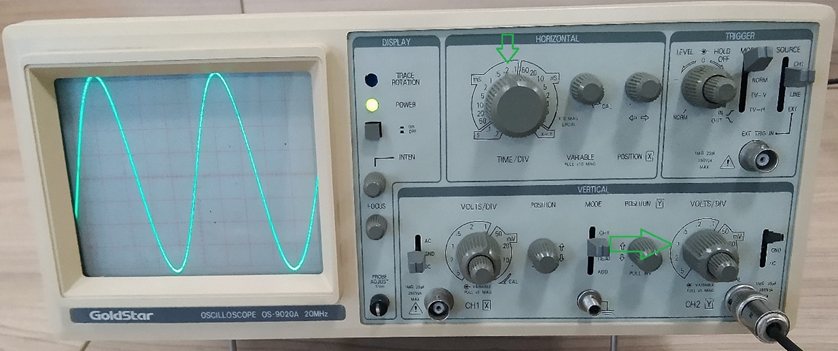
- Cathode Ray Tube oscilloscope “GoldStar OS-9020A” – 1 pcs;
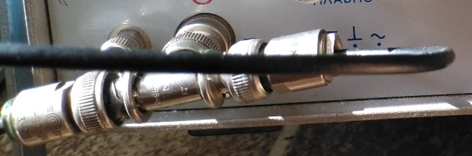
- connector tee – 1 pcs;
- HF connecting cables – 3 pcs.
Task 2.1: Learn the frequency counter control board and adjustments.
Students are obligatory to learn the theory for this practice lab exercise. Also, to get familiar with the devices and their control buttons and adjustments.
Task 2.2: Define the relative error in capacitor frequency counter.
The measurement equipment must be connected as shown on fig. 4. The check must be made over all measurement ranges with digits of the capacitor frequency counter.
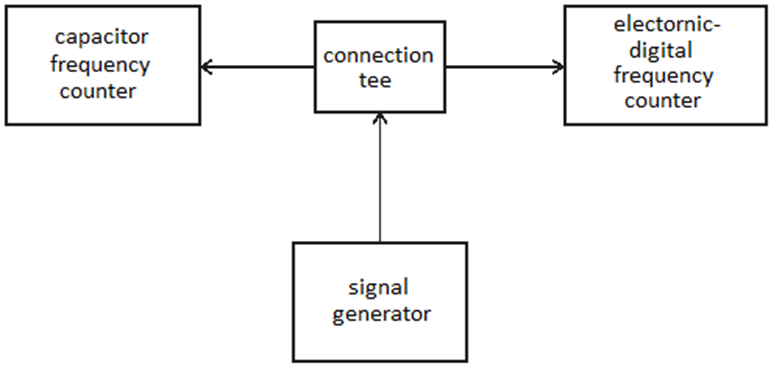
Fig. 4
The measurement error is calculated by the formula:
where: fmeas is the measured frequency by the capacitor frequency counter;
flabel is the frequency measured by the control (reference) frequency counter
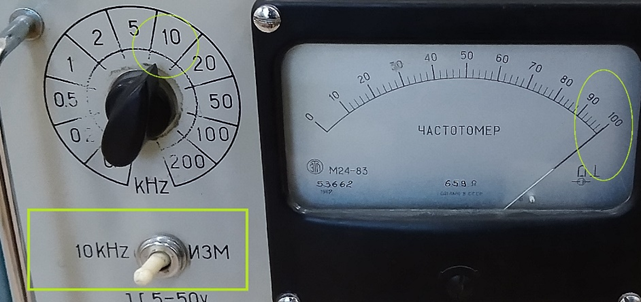
Before measurement start, the capacitor frequency counter must be calibrated. It is done by rotating the kHz range lever to position „10“, and then the “10kHz-ИЗМ” switch to position “10kHz”. The arrow must be positioned under digit „100“ at final right position. By means of the calibration potentiometer the device can be correctly calibrated if needed. After calibration, the switch is put to „ИЗМ“ position.
The measurement results for all subranges of the capacitor frequency counter in the beginning, in the middle and in the end of the digit scale are to be written in table 1.
Task 2.3: Measure the frequency with CRT oscilloscope using time interval means.
To perform this task, the signal of unknown frequency is fed to input Y of the CRT scope. The CRT scope must be calibrated on X-axis prior start of measurement, which means calibration of time-axis. For this purpose, the lever “VARIABLE” must be positioned precisely.
The frequency check is done by measuring the time intervals (measurement of repeat interval Trep) projected onto the plastic screen physical scale in terms of section counts. After that, the number of counted sections is multiplied by the time equivalent value for the X-time axis. The frequency is calculated by the famous formula:
Task 2.4: Create a written report with the measurement results.
Present a written report for the performed measurements. Present in graphical form the data from the error table at the beginning, middle and end of the scale. Point out conclusions for all tasks of this lab exercise in the report.
Control questions:
1. What is the capacitor reload method?
2. Describe the counter scheme of capacitor frequency counter?
3. How does the comparison method work – the heterodyne frequency counter?
Images of used devices:
Low frequency signal generator “ISOT 9202” – 1 pcs.
Automatic frequency counter „PFL-30“ – 1 pcs.
Capacitor frequency counter „ЧЗ-7“ – 1 pcs.:
Cathode Ray Tube oscilloscope “GoldStar OS-9020A” – 1 pcs.:
Connector tee – 1 pcs.
HF connecting cables – 3 pcs