SPECTRAL ANALYSIS OF AMPLITUDE AND FREQUENCY MODULATED SIGNALS (FREQUENCY DOMAIN)
The purpose of this laboratory exercise is to enhance the skills of learners to create and observe the spectral analysis of AM and FM signals, to process the data from the measurements and to present the results.
1. Theoretical introduction.
In this laboratory exercise, the spectral analysis of the AM signal is considered in order to better master the theory of modulation. Amplitude modulation uses the modulating signal to control the amplitude of the high frequency carrier signal. The modulating signal is used to alter the carrier signal amplitude in proportion to the modulating signal amplitude. A high frequency carrier signal that is amplitude modulated is called an AM waveform. An AM waveform can be observed as: an ordinary AM wave; double-sided AM with attenuated carrier and single-sided AM with attenuated carrier. An amplitude modulated signal can be described mathematically as follows. Assuming that the modulating signal is a sinusoidal frequency (Ω=2.π.f.t) and
uΩ(t) = UΩm cosΩ t = UΩmcos2πfΩ t
then the carrier signal is:
uc(t)=Ucmcosωct = Ucmcos2πfct
Since the carrier frequency remains unchanged after amplitude modulation and the amplitude of the AM wave is proportional to the modulating signal, therefore the modulated wave can be expressed by the expression below:
uAM (t) = UAM (t)cosωct = Ucm(1+МcosΩt) cosωct
To simplify the analysis, it is assumed that the initial phase angle of the two waveforms is zero. The factor M here is known as the AM modulation factor or the AM modulation index, namely:
The upper equation shows the extent to which the amplitude of the carrier is controlled by the modulating signal. The constant M is a proportional constant determined by the modulation circuit. The AM modulation index must be less than or equal to 1. When the AM modulation index is greater than 1, it is called over-modulation and will degrade the modulated signal. Important is that the information in the modulating signal is carried by the amplitude of the amplitude modulated wave.
The presented mathematical description for the time domain of an AM modulated signal can be transformed (expanded) of its frequency components. The form acquired is:
As can be seen from this expression, a modulated AM signal consists of three high-frequency components. In addition to the carrier, two new frequency components are included (ωc + Ω) and (ωc - Ω). One is higher than ωc, known as the upper sideband, and the other is lower than ωc, known as the lower sideband. Its spectrum is shown in Figure 1:
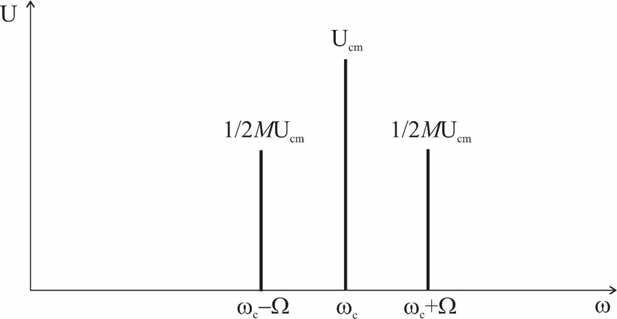
Fig. 1 – AM waveform spectrum
Frequency modulation systems have very good noise protection and are widely used for high quality radio broadcasting in the VHF range, for the transmission of the audio signal in television systems, radio relay and satellite communication systems. If the modulation is performed with one sinusoidal tone, then the expression for the frequency-modulated oscillation will look like:
,
where: Um - amplitude of high-frequency oscillation; f0 or ω0 = 2πf0 - high (carrier) frequency,; F or Ω = 2πF - frequency of the modulating voltage,; mf - frequency modulation index, determined by the expression:
,
where Δf - high frequency deviation during modulation (frequency deviation).
The instantaneous value of the frequency of the frequency-modulated signal is f = f0 ± Δf. The frequency deviation during modulation is proportional only to the amplitude of the modulating voltage and does not depend on its frequency:
.
Figure 2 shows the graph of the frequency-modulated oscillation corresponding to the analytical expression. The frequency of the modulating oscillation determines the rate of change of the instantaneous value of the deviation.
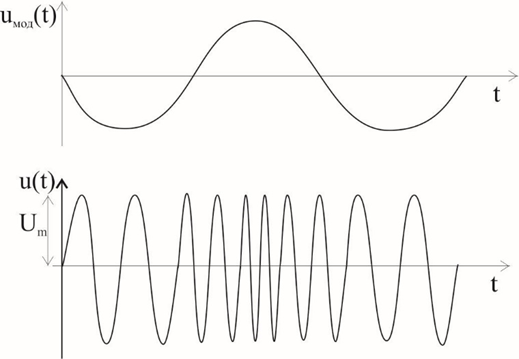
Fig. 2 – FM waveform in the Time domain
In the practice of radio measurements the frequency deviation is usually determined. The frequency modulation index for single frequency modulation can be determined if the frequency deviation and the frequency of the modulating voltage are known. For accurate measurement of frequency-modulated oscillations during tuning and calibration of measuring devices, the frequency modulation index mf is determined by measuring the frequency deviation.
2. Practice tasks.
Practice task 2.1: Study the scheme, the principle of operation and the purpose of the control and regulation of the instruments used for spectral analysis of AM signals.
To perform a spectral analysis, the following equipment is necessary:
Digital storage oscilloscope
GDS-1072-U
RF cable 100mm
RF cable 800mm
Adapter N-SMA
Students are required to independently study the topic material passed. During the instructions, held on the day prior the planned laboratory session, every student is obliged to get acquainted with the devices’ technical documentation, the control levers located on the respective device and the way of connecting the test setup.
Experiment steps:
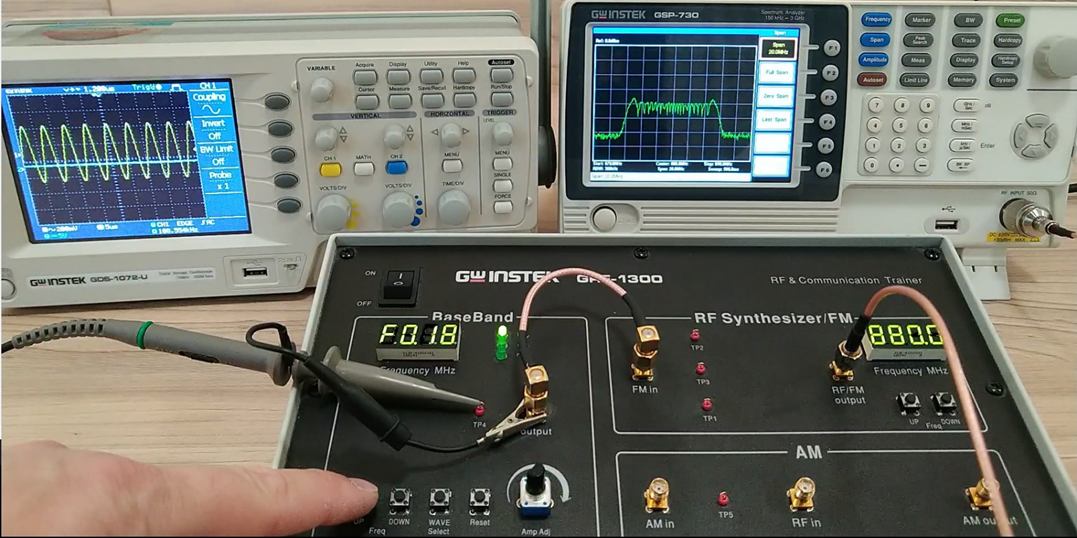
1) Power on the GRF-1300 and GSP-730 devices.
2) Set the GRF-1300 as follows:
· Set the GRF-1300 to the default power-on status (by pressing the „reset“ buton);
· Connect the BaseBand module „output“ port to the „AM in“ port of the AM module with the given BNC standard RF cable;
· Connect the „RF Synthesizer/FM“ module “RF/FM output” port to the “AM” module “RF in” port with the given BNC standard RF cable;
· Turn the “Amp Adj” potentiometer clockwise till the end.
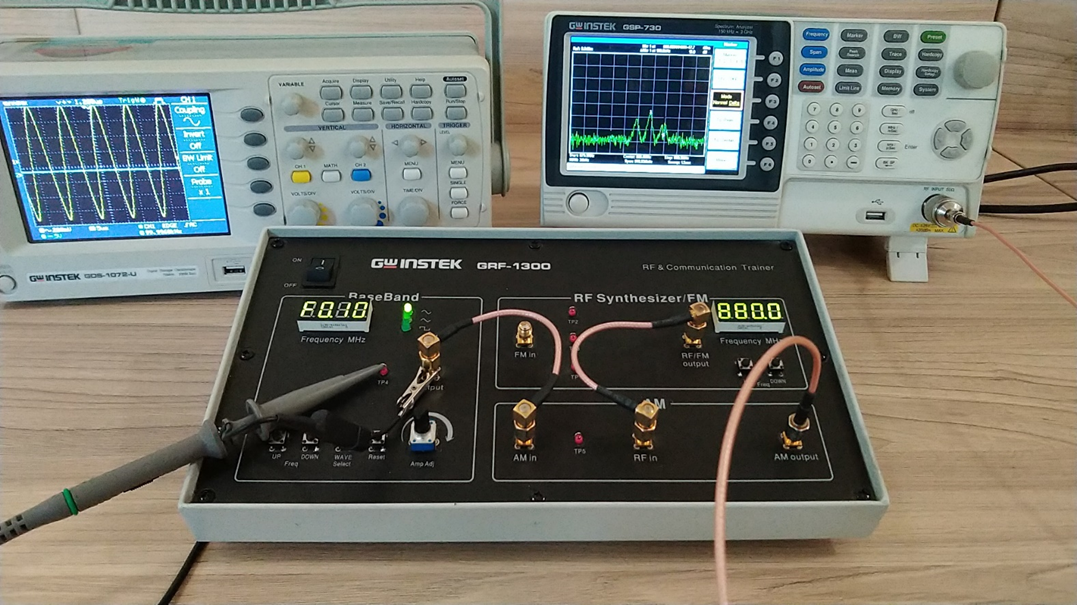
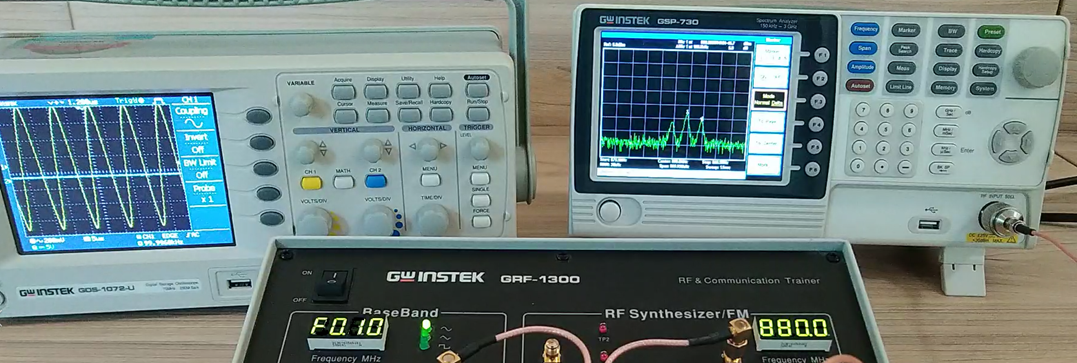
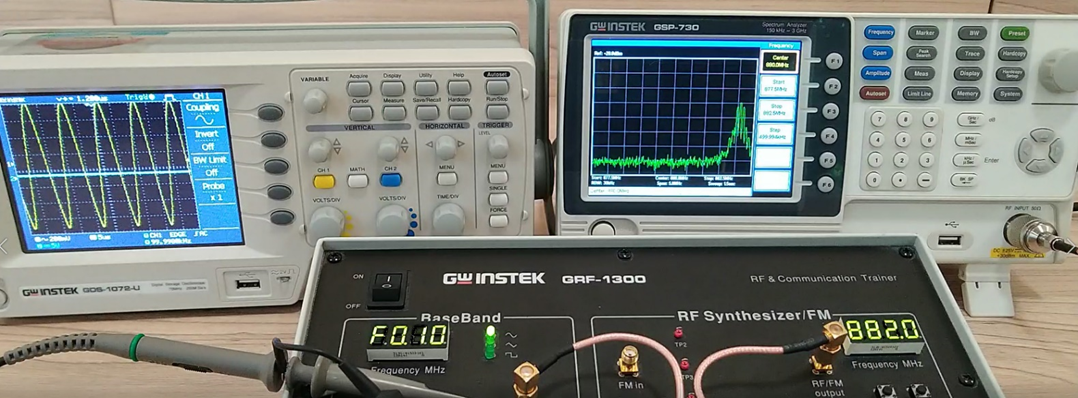
3) Connect the AM output port to the input port of the spectrum analyzer with an 800mm RF cable as shown on fig. 3.
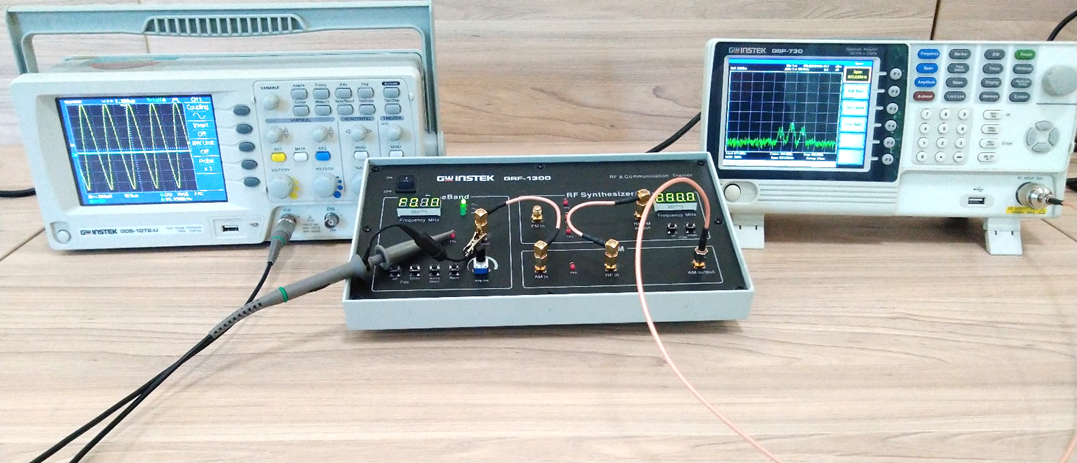
Fig. 3 – Connection circuit.
Practice task 2.2: Measure the shape and spectrum of an AM waveform.
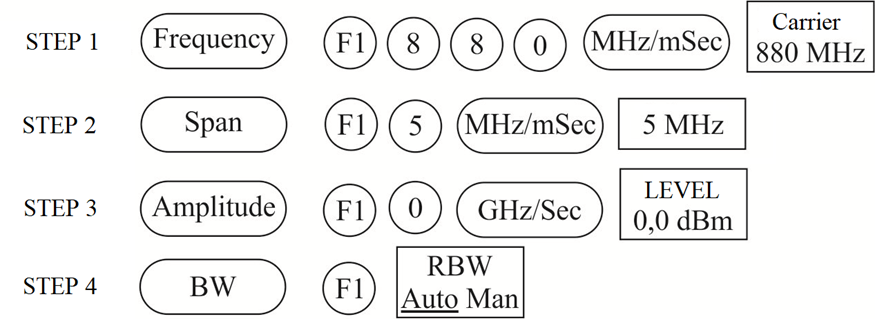
For this task, the GSP-730 should be configured as follows:
· Central frequency: 880 MHz;
· Span: 5 MHz:
· Amplitude reference: 0 dBm;
· Resolution Bandwidth (RBW): Auto.
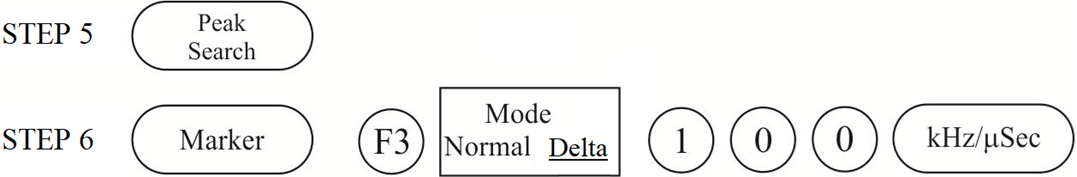
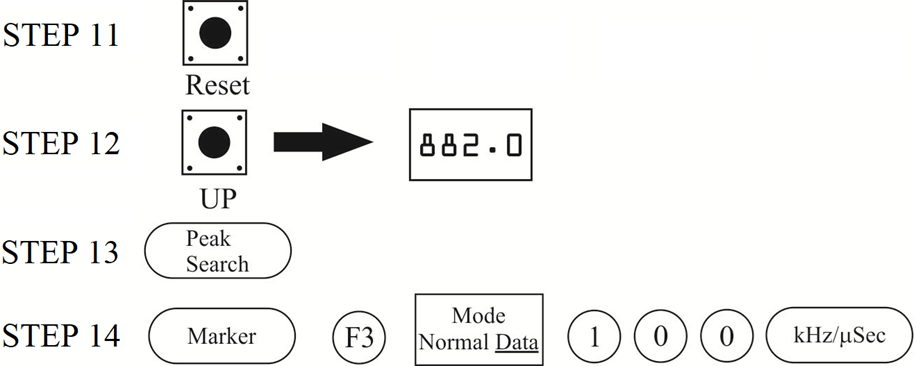
Use the Marker function of the spectrum analyzer to measure the AM waveform carrier component and the magnitude of the upper and lower sidebands. This is done by pressing the “Peak Search” button, then “Marker”, then F3, marking “Delta” which is followed by pressing the 1 0 0 digits, and the button “kHz/µSec”.
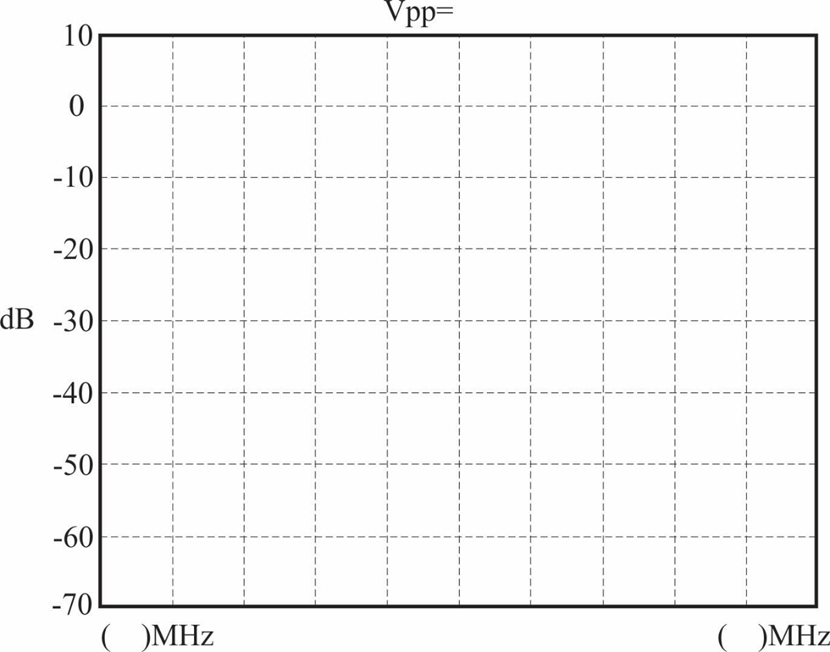
Use the oscilloscope to measure the voltage in TP4 relative to the position of the potentiometer. Draw the spectrum diagram in a graphic in the Experiment results diagrams.
Turn the potentiometer counterclockwise halfway. Measure the voltage with an oscilloscope. Do you observe any change in the spectrum by changing the output amplitude of the modulating signal? Record the experiment as a hand-drawn graphic in the Experiment results diagrams.
Turn the potentiometer counterclockwise to reduce the output voltage. Measure the voltage with an oscilloscope. Observe all changes in the spectrum of the AM waveform and record them in a graphic.
Practice task 2.3: Measure the AM waveform spectrum with modulating signals of different frequencies.
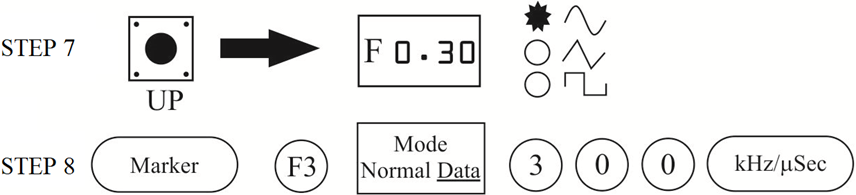
For this task, turn the amplitude potentiometer clockwise to the maximum. Press the UP button on the Baseband module to adjust the frequency of the modulating signal (300 kHz). Do you see any change in the spectrum of the AM waveform? Compare the results of the experiment with the results of the initial Baseband frequency of 100kHz and record them.
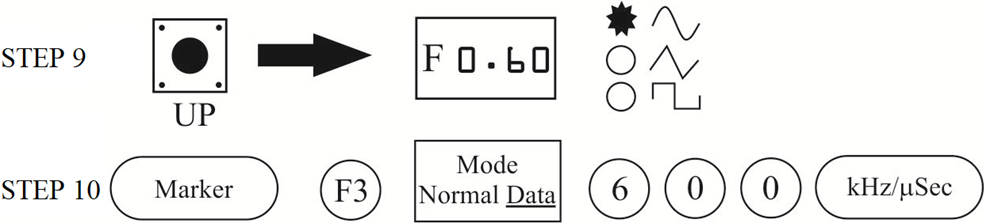
Use the UP button on the Baseband module to adjust the frequency of the modulating signal (600 kHz). Do you see any change in the spectrum of the AM waveform? Record the experiment as a hand-drawn graphic in the Experiment results diagrams
Practice task 2.4: Measure the AM waveform spectrum with different carrier frequencies.
This task should follow the order, having the previous tasks finished. After completing the above steps of the experiment, press the Reset button and then use the UP button on the RF Synthesizer / FM module to change the signal carrier frequency to 882 MHz. Is there any change in the spectrum of the AM waveform? Compare the result of the experiment with that of the initial carrier frequency 880MHz and record it in a table.
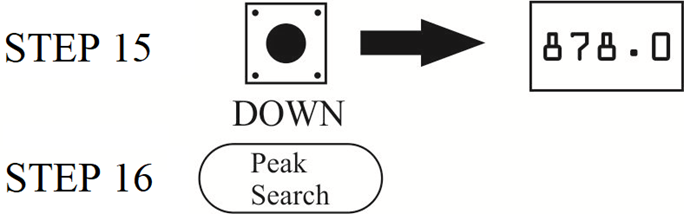
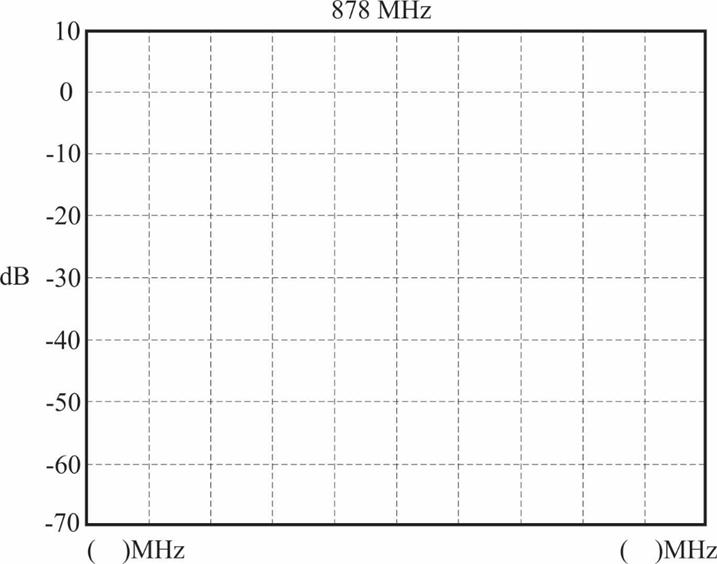
Use the DOWN button on the RF Synthesizer / FM module to change the carrier signal frequency (878 MHz). Observe if there is any change in the AM wave spectrum and record the experiment as a hand-drawn graphic in the Experiment results diagrams.
Practice task 2.5: Measure the FM waveform spectrum with modulating signals of different frequencies.
For this task the BaseBand module “output” port should be connected to the “FM in” port of the “RF Synthesizer/FM” module, and the spectrum analyzer connected to the “RF/FM output” port. The “AM output” port should be disconnected.
Now, on the “BaseBand” module we can press the UP button to increase or DOWN button to decrease the modulating baseband frequency. We press UP until “F 0,30” MHz (300 kHz) and until “F 0,60” MHz (600 kHz). Those would be the three values of modulating frequencies. Furthermore, while being at a chosen value of a baseband frequency, one can rotate the Amp Adj lever in order to observe the FM modulated signal spectrum.
EXPERIMENT RESULTS
Task 2.2: Change the amplitude of the modulating voltage for 3 values:


Task 2.3: Change the modulating frequency for 3 values: 100, 300 and 600 kHz.


Task 2.4: Change in the carrier frequency for 3 values: 880, 882 and 878 MHz.


Control questions.
1. If the modulating frequency is altered, while the amplitude kept constant, will the AM modulated waveform got changed?
2. What would happen if the BaseBand “output” port is connected to the “FM in” port and the “RF/FM output” port connected to the “AM in” port?