MEASUREMENT OF MODULATED SIGNALS. AMPLITUDE MODULATION MEASUREMENTS (TIME DOMAIN)
The purpose of this practice laboratory exercise is to acquaint students with the basic methods for measuring the parameters of amplitude-modulated signals, to acquire skills for measuring the depth of modulation, to process measurement data and to assess their accuracy.
1. Theoretical introduction.
Amplitude, frequency phase, pulse and combined type of modulation are used in radio engineering devices. In the first three types of amplitude modulation, the frequency (phase) of a sinusoidally modulated signal varies according to the law of change of the modulating voltage.
An amplitude modulated electrical signal with one sinusoidal tone can be represented as:
,
where: Um – the amplitude of unmodulated high frequency signal;
f – carrier frequency, ω=2πf;
F – modulating frequency, Ω=2πF;
М – modulation coefficient (modulation factor).
The modulation coefficient of the high-frequency oscillation M is numerically equal to the ratio of the change in its amplitude ΔUm to the maximum amplitude Um when there is no modulation:
.
This ratio is usually expressed as a percentage
In pulse modulation, the amplitude, repetition rate, duration or temporal position of the video pulses is changed according to the law of variation of the low frequency modulating signal.
Measurement of the amplitude modulation coefficient with a cathode ray tube oscilloscope.
The oscillographic method for measuring the coefficient of amplitude modulation M can be performed by linear time-sweep X-axis, sinusoidal and circular (elliptical) X-axis resolution of the CRT scope.
With linear time-sweep X-axis, the measured high frequency modulated signal is set onto the cathode ray vertical deviation channel (Y-channel). The frequency of the linear axis is chosen 2-3 times lower than the modulating (the carrier) frequency and the synchronization is performed according to the frequency of the modulating voltage. The oscillogram of the modulated signal should appear on the CRT screen in the way Y=f(t) (fig. 1)
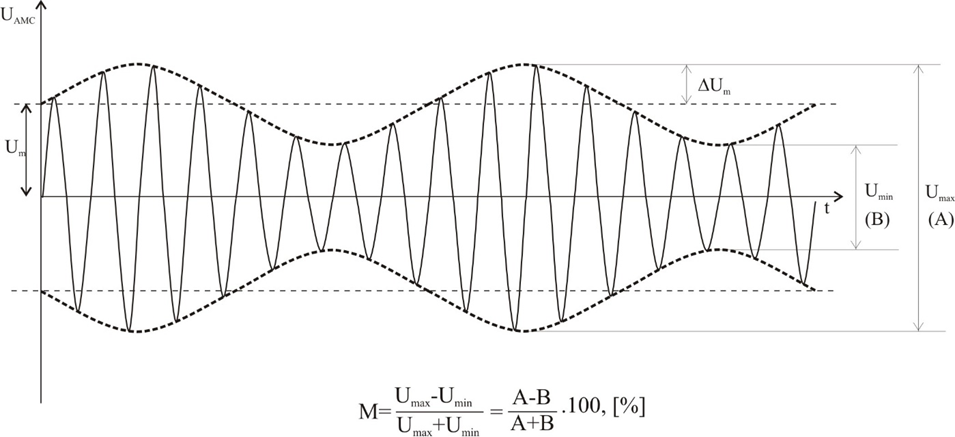
Fig. 1
The maximum (А=2Umax) and minimum (В=2Umin) ray deviation is measured on the oscilloscope screen using the scale grid.
The amplitude modulation factor M is calculated according to the formula
In some cases, into the vertical ray deviation channel, the detected (converted as direct current) signal can be fed (fig. 2).
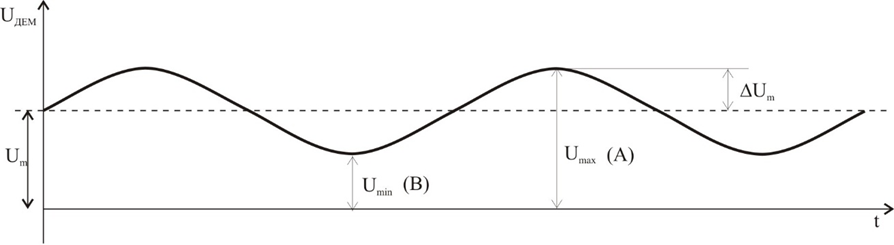
Fig. 2
When the CRT input is open, the constant voltage component is let and the oscillogram, which is the low-frequency modulated signal, will appear on the screen. Values A and B are measured relative to the zero line of the time sweep synchronization.
With sinusoidal and X-axis resolution the amplitude-modulated high frequency signal is set on Y channel. In this case, the ray deviation in vertical direction will be determined by the ratio , and in horizontal direction by . Here, if we make a substitution, we get Y=M.X+Um. This means that the envelope will have the type of straight line with a slope determined by the value of the amplitude modulation coefficient. On the CRT screen trapezoid image or other form will be projected. The oscillogram will have the type shown on fig. 3.
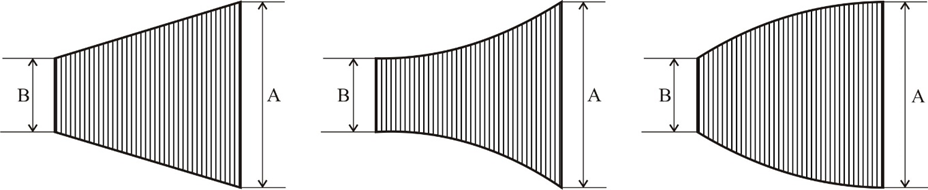
Fig. 3
The measured values of A and B correspond to the max and min values of the modulating voltage and therefore the calculation of M can be performed according to the formula. The second and third oscillograms shown in fig. 3, testifies to the presence of nonlinear distortions in the modulation process. This method of measuring M is known as the trapezoidal method. At M=100% the trapezoid will become a triangle, and at M=0% the trapezoid will become a rectangle. The modulation factor is determined by the expression for M.
With circular (elliptical) X-axis resolution in order to measure the modulation coefficient it is necessary to supply the amplitude modulated signal via RC circuit (phase shifter) to plates X and Y with internal CRT sweep synchronization turned off. In this case, a sweep voltage can be obtained when the modulated signal is fed through the amplifiers for vertical (Y) and horizontal (X) ray deviation due to internal phase shifts of the two channels. The shape of the luminous elliptical figure is shown in fig. 4.
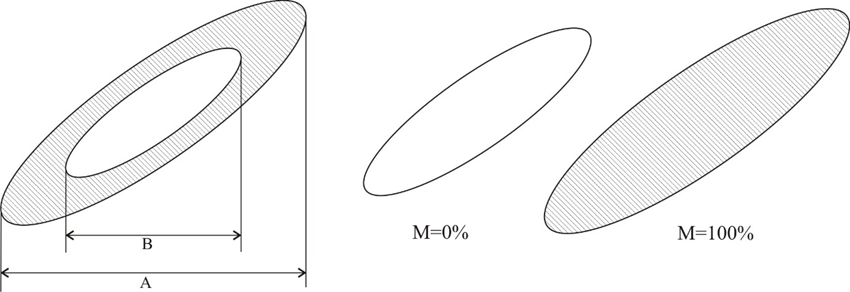
Fig. 4
The thickness of the ring is proportional to the depth of modulation and the dimensions A and B of this figure depend on the Amplitude Modulation factor. The solid line in the figure corresponds to M=0, i.e. without amplitude modulation of the signal. The modulation factor is determined by the well-known expression for M.
Another method for measurement AM signals in CRT scope is one without X-axis sweep. When the horizontal (X-axis) sweep voltage is switched off (internal sweep-synchronization switched off), the tested amplitude-modulated signal is applied to the vertical plates. A vertical straight line of varying brightness will appear on the oscilloscope screen. This is due to the unequal speed of the electron beam. The brightness between the transition points is the lowest due to the higher velocity of the electron beam (fig. 5).
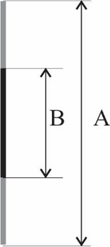
Fig. 5
In order the transition to be seen accurately, it is necessary to work with greater brightness of the oscilloscope. The electron ray should also be focused. In this method, the value of A can be determined relatively accurately, but the value of B cannot be reported quite accurately, because it is determined only by end points. The oscillographic method is simple and convenient. Drawing errors do not exceed 5-7%. The accuracy of the measurement depends on the focusing of the electron beam and the accuracy in measuring the dimensions A and B of the obtained oscillogram.
Measurement of the frequency modulation coefficient with a cathode ray tube oscilloscope.
Usually, in frequency modulated signals fast parameters measurements, the frequency deviation is determined by the frequency detector method. The essence of this method consists in the conversion of the frequency - modulated signal into amplitude modulated and then redetected. The amplitude obtained as a result of the detected voltage is proportional to the frequency deviation and does not depend on its carrier frequency. This voltage can be measured with an amplitude voltmeter, the scale of which is graduated in units of frequency deviation – usually in kHz. Instruments designed to measure frequency deviation are called deviometers.
2. Practice tasks and instructions:
The connection circuits should contain the following equipment:
- cathode ray tube oscilloscope – 1pc.
- high frequency measurement generator – 1pc.
- low frequency measurement generator – 1pc.
- modulation tester – 1pc.
- HF triple – 1pc.
- HF connecting cables – 4pcs.
Task 2.1: Learn the circuit scheme, the principle of operation and the purpose of the control board and regulation levers of the instruments used for measuring the AM factor.
Students must learn the theory over this topic materials. During the instruction in the laboratory, prior this practice exercise, all students have to acquaint the devices’ technical documentation, the control boards of respective devices and hot the test setup must be connected. Readiness for this laboratory exercise is checked at the beginning of the class.
Task 2.2: Determine the relative error when measuring the coefficient of AM by CRT using linear, sinusoidal and elliptical X-axis sweep voltage.
The task is to determine the coefficient of AM using the oscillographic method. A modulation meter is used as a control device to determine the error in the measurement of the AM coefficient. The block diagram of the measurement circuit setup is shown in fig. 6.
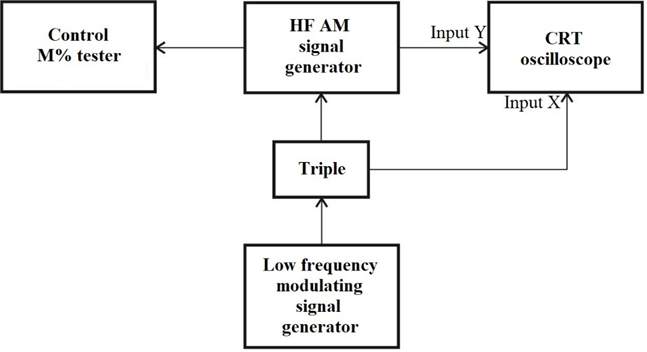
Fig. 6
By means of the regulation of the output voltage of the low-frequency generator for the modulating signal the corresponding values of the modulation coefficient M for the specific measurement method are set.
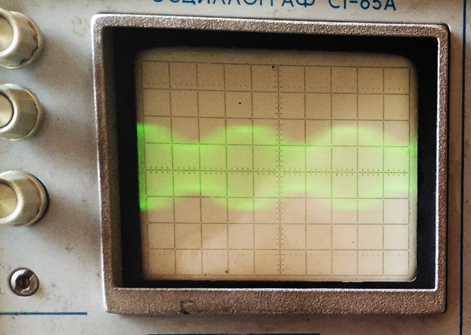
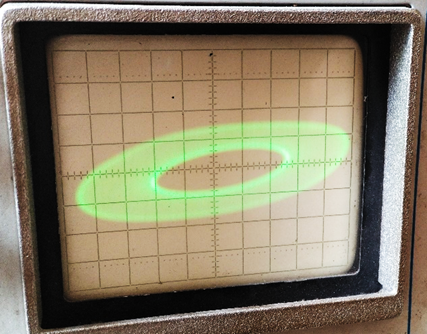
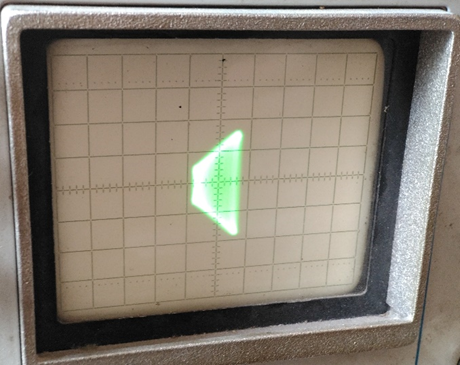
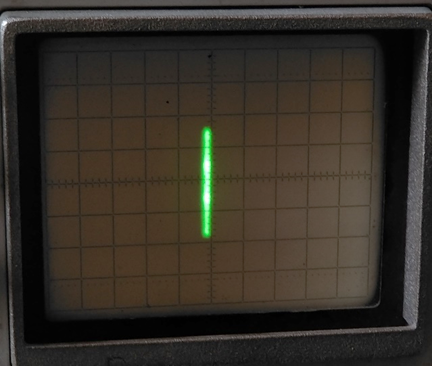
Fig. 7 – Linear-, sinusoidal-, elliptic- and non-existing - X-axis time sweep voltage images of AM modulated signals
The exact value of the AM coefficient is determined by the readings of the control meter for M. The reading of A and B is performed on the mechanical scale of the CRT screen as the number of divisions. The true value of the coefficient M is read by the modulation meter. The preparation of the modulation meter and its calibration is performed according to the given methodology. The results of the measurements are written in Table 1.
Task 2.3: Create a written report over the measurements
To create a written protocol, follow the requirements and present in graphical form the relative error data for the different methods of measuring M. Formulate conclusions on all tasks of this exercise.
Control questions:
1. Compare the oscillographic methods for measuring the amplitude modulation coefficient M. Define limitations in the choice of method. Which are the sources of errors?
2. Describe the measurement of M by direct current conversion.