MEASUREMENT OF VOLTAGE AT HIGH FREQUENCIES
The purpose of this laboratory exercise is to enhance the skills of learners to define errors of different measurement equipment in various frequency ranges.
1. Theoretical introduction.
The voltage between two points A and B is a scalar value, defined by:
,
where E is the intensity of the electrical field.
Voltage values of interest in radio equipment are Effective value, Peak value, and Mean value. The Effective value is the mean square for each and every value in the time domain, often one period of the harmonic signal.
.
The time period T (time for addition) is defined by the most inert node of the measurement equipment. The Peak value (the amplitude of each harmonic) is the largest absolute value of the measured voltage (for one period of the harmonic signal). Care must be taken for Peak measurement in positive or negative polarity. The Mean value is also called Constant value and is described as:
.
There is also a Mean Direct voltage value which is the mean of all absolute voltage values, described as:
.
For unipolar voltages, the Mean and Mean Direct value are equal. For bipolar voltages these two values may differ explicitly. Examples are: Umean=0; Umean direct=0,637.Um. There may be relation between the peak, the actual and the mean direct voltage values. This is characterized with amplitude coefficient Ka and waveform coefficient Kf .
On Table 1 some coefficient values are shown.
Most of the electronic voltmeters contain nonlinear converters. With the nonlinear characteristics, the measurement device adds signal components to the output that are absent in the input. For voltage measure, an appropriate way is to detect the constant value of the electric current (Direct Current, DC), which is in a function of the voltage value to be indicated. The measured signal value must be amplified and then indicated with electromechanical device for example. The main operations in a voltmeter are:
- converting the measured voltage with the means of a nonlinear node and separating the constant value component;
- amplification of the constant value component;
- measurement of this constant value with pointing device.
Two types of voltage measurement are presented on figure one – a) without preamp, and b) with preamp. The first type is also called “Detector-Amplifier”, and the second is called “Amplifier-Detector”.
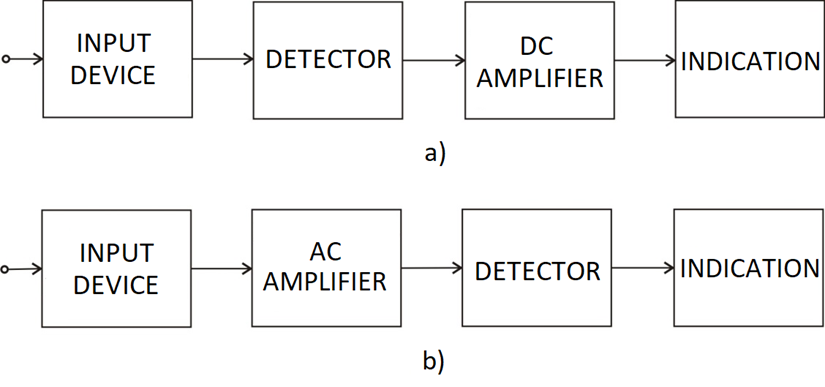
Fig. 1 – High frequencies measurement
The measured values are taken from pointing arrows or from digital displays. Error check can be performed by comparison of reference device and the used measurement device, as shown in figure 2.
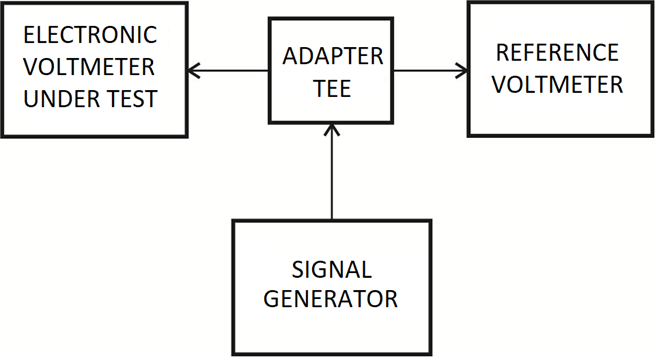
Fig. 2 – Block-scheme for voltage measurement at high frequencies
The main error is defined in percentage (δperc) or as relative (δ) by the formulas:
,
where Utested is the indicated voltage taken from the tested device’s scale;
U0 - is the indicated voltage taken from the reference voltmeter scale;
Uк – scale’s upper bound voltage of the tested voltmeter.
The preciseness of the operator should be taken in mind while using CRT oscilloscopes.
Connection circuit description.
To perform this practice lab the connection circuit includes:
- Electronic voltmeter – 1 pcs.;
- Reference voltmeter – 1 pcs.;
- Multifunctional signal generator – 1 pcs.;
- Cathode ray tube oscilloscope – 1 pcs.;
- Connector tee – 1 pcs.;
- HF connecting cables – 3 pcs.
2. Practice tasks and instructions.
Task 2.1: Learn the block-schemes, functionality, and controls of the tested voltmeters.
For practice task 2.1 learners are obligatory to get familiar with the theoretical aspects. Every student should get familiar with the devices’ technical documentation.
Task 2.2: Define the main error in percentage and the relative error of digital voltmeters of type “Amplifier-Detector”.
For practice task 2.2 all necessary devices must be connected as required in fig. 1. Rules of engagement here include definition of main ranges and choice of appropriate values in order to avoid reference voltmeter overload. To perform an HF voltage measurement of a sinusoid, a 10KHZ frequency is set in the signal generator, and the amplitude will be altered in accordance with the digit-stripes scale, as presented in table 2. The measurement results are filled in table 2
fscale.=10 kHz Table 2.
Digit-stripes scale
Task 2.3: Define frequency relevance with the relative error of electronic “Amplifier-Detector” voltmeters in high-frequency measurements.
For task 2.3, the amplitude of output signal is fixed as constant (for example 2V) and the frequency is subsequently altered for measurements. The measurement results are filled in table 3.
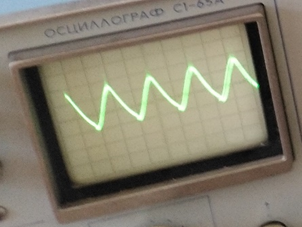
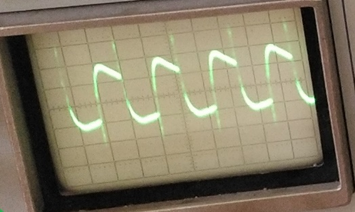
To perform an HF voltage measurement of a triangle waveform, the signal generator must have the possibility to generate such one. The new measurement values are filled in tables similar as table 2 and 3.
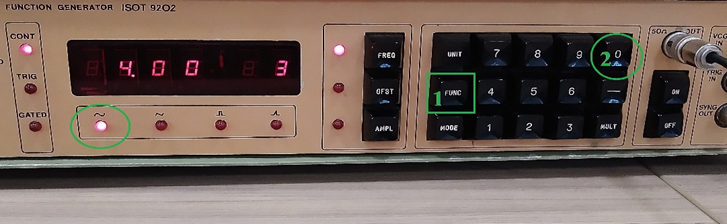
Steps for measurements with device ISOT 9202 S:
1. Switch ON and OFF the 50Ω RF output. After switching ON (green box 1), the generated voltage waveform is transferred to the output with internal impedance 50Ω.
The signal is then taken from coaxial connector (BNC) “50 Ω OUT”. To shut down the output voltage waveform, turn the switch to “OFF” (red box 2).
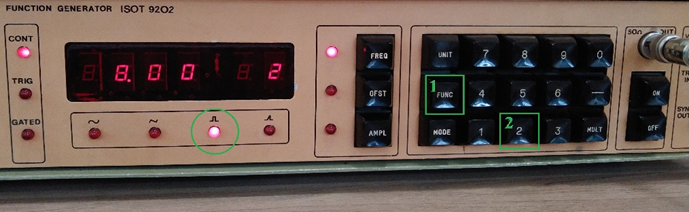
2. Waveform choice. This generator creates voltages with the following waveform: sinusoidal, triangular, rectangular and a saw-form. The choice is made after pressing the “FUNC” button, and pressing the keyboard as follows:
- for sinusoid waveform – “0”:
- for saw-tooth waveform – “1”:
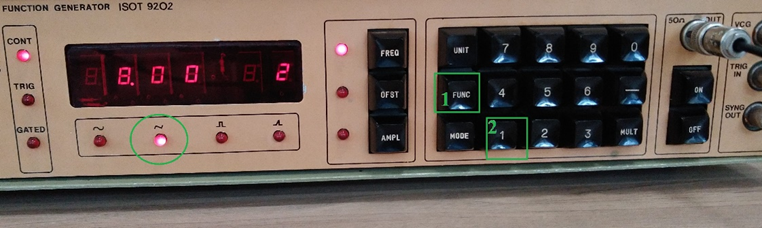
- for rectangular waveform – “2”:
- for triangular waveform – “3”:
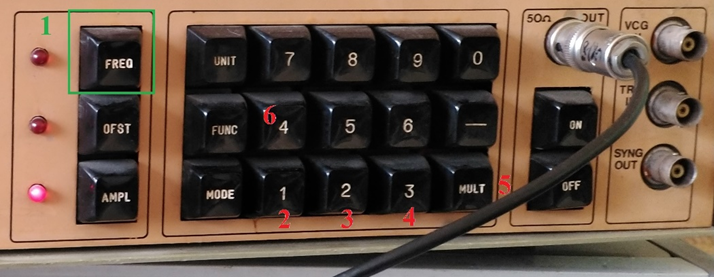
3. Frequency set. The frequency for the output waveform is programmed by pressing the button “FREQ”, and then a three-digit value is set by the keyboard from 0,00 to 9,99. After setting the three-digit value, the button “MULT” is pressed and choice of N is done between 0 and 6 keyboard key, defining 10 to the power of N. A simple example is the frequency 12,3 KHZ setup: step 1 - Press: “FREQ”; step 2 - press “1”; step 3 - press “2”; step 4 – press “3”; step 5 - press “MULT”; step 6 - press “4”.
4. Amplitude set. This setup is made by pressing the button “AMPL” and then a three-digit value by the keyboard from 0,00 to 9,99. After setting the three-digit value, the button “MULT” is pressed and choice of N is done between 0 and 2 keyboard key defining 10 to the power of N. If “1” or “2” is chosen, the selected value of the voltage output will be decreased 10 or 100 respectively. A simple example is the amplitude value 789 mV setup:
Press: “AMPL”, then “7 8 9”, then “MULT” then “1”:
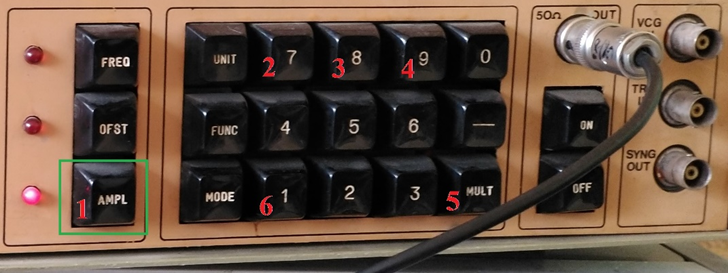
This amplitude value is only for 50 Ohms payload! If the payload is 0 Ohms, the amplitude value is twice larger!
NOTE: This way of output signal amplitude setup defines a maximum value Um. But the HF electronic voltmeters measure the effective value U. Relevancy between these two values is given by the coefficient Ka (see table 1). So for example, if a 1V effective voltage value must be set and measured by the voltmeter, 1,4V voltage value must be set on the signal generator.
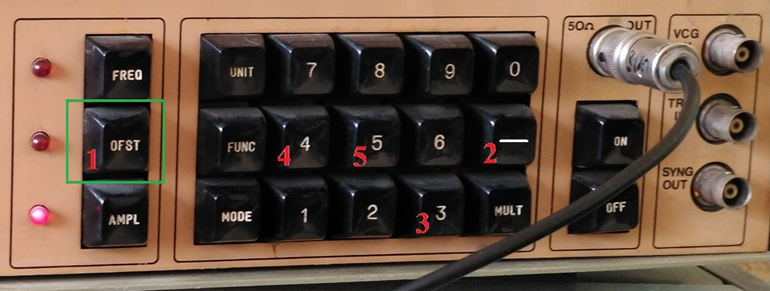
5. Fixing the direct-current offset. The generator’s output signal may be on level 0 or on an offset level. This is programmed by the button “OFST”, followed by a three-digit value by the keyboard from 0,00 to 5,00. Negative offset values are available for programming by the button “-”. Example: To program an offset of 3,45V with negative polarity, press:
“OFST”, then “-”, then “3 4 5”:
Task 2.4: Define frequency relevance with the relative error in high-frequency measurements with CRT oscilloscopes.
For task 2.4, precise calibration of the CRT oscilloscope is necessary. This is done by means of the internal calibrator having its output connected to the “Input on X axis” of the scope. The potentiometer “Amplification on Y” should be slowly rotated to right end position. Measurement of the voltage is made according with the graphical scale row having the number of divisions multiplied by its corresponding value. If disparity is found, calibration of “Input Y” should be accomplished.
Connecting this circuit should happen as shown on fig. 3.
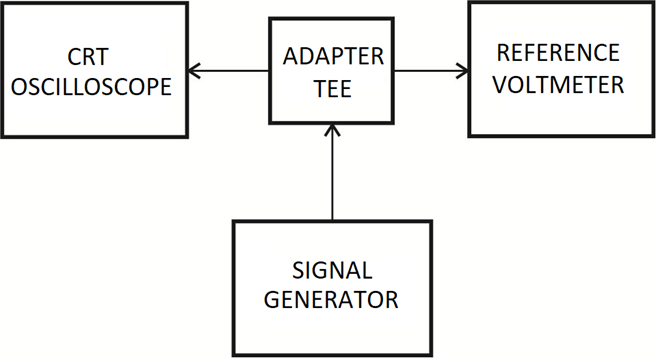
Fig. 3 – Connection circuit for frequency relevance measurement
Results for calculation of δ,[%] are used for a frequency dependent diagram plot. The signal generator keeps unique level of output voltage, traced by the electronic voltmeter Udvolt. The frequency of the measured signal is altered at least for 10 values between lower and upper frequency range bounds. The measurement results Ucrt are filled in table 4.
Table 4
Frequency, kHz
Task 2.5: Write a report on the performed measurements.
For task 2.5, the report should contain description of the circuit, written tables with data and clearly drawn graphic plots, as well as common conclusions.
3. Control questions.
3.1 What are the differences between “Detector-Amplifier” and “Amplifier-Detector” electronic voltmeters?
3.2 Describe the electronic voltmeters for effective values.
3.3 Describe the electronic voltmeters for amplitude values.
3.4 Describe the selective voltmeters.
3.5 Describe the digital voltmeter.
3.6 Describe the HF signals CRT oscilloscope measurement features.
Images of the used devices:
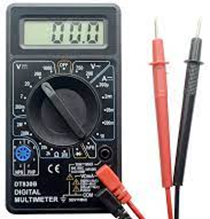
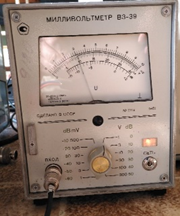
Electronic voltmeter; Reference voltmeter;
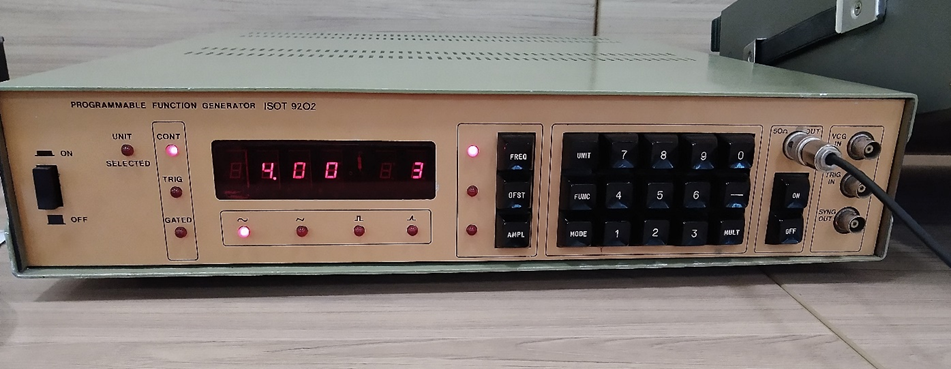
Multifunctional signal generator
Cathode ray tube oscilloscope
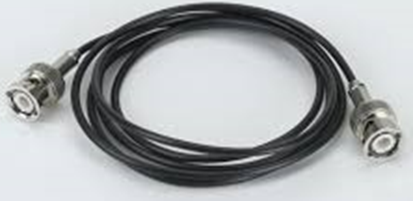
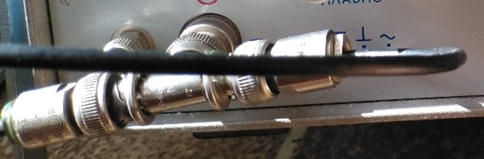
HF connecting cables Connector tee